Choose the transfer function of the system from the given set of systems by clicking it.
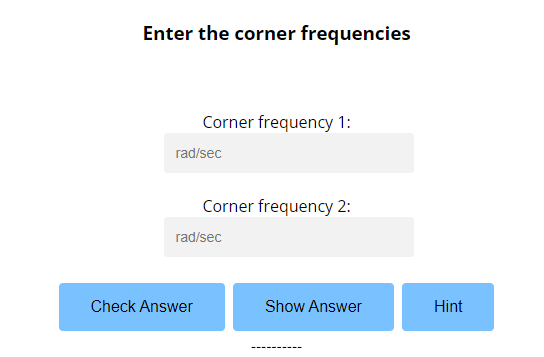
The user would calculate corner frequencies present in the chosen transfer function and feed the answers in specific text box given. Then the user will press check answer and display the solutions for checking the entered values are correct. If the answer is correct, the simulation will display ‘Correct’ else the user can click the help button to get the help.
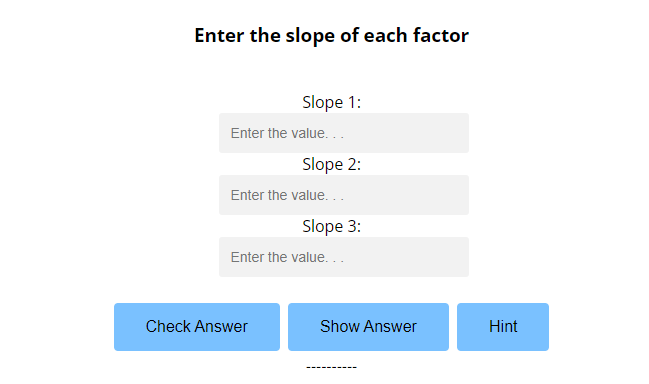
The user would identify the slope value for the selected transfer function using the logic and feed the answers in specific text box given. Then the user will press check answer and display the solutions for checking the entered values are correct. If the answer is correct, the simulation will display ‘Correct’ else the user can click the hint/help button to get the formula to be used for calculation.
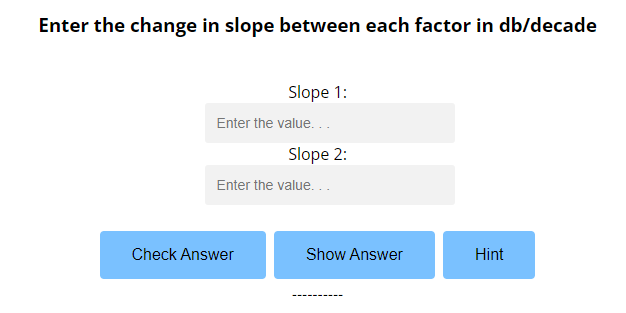
The user would identify enter the change in slope between each factor in db/decade and feed the answers in specific text box given. Then the user will press check answer and display the solutions for checking the entered values are correct. If the answer is correct, the simulation will display ‘Correct’ else the user can click the hint/help button to get the formula to be used for calculation.
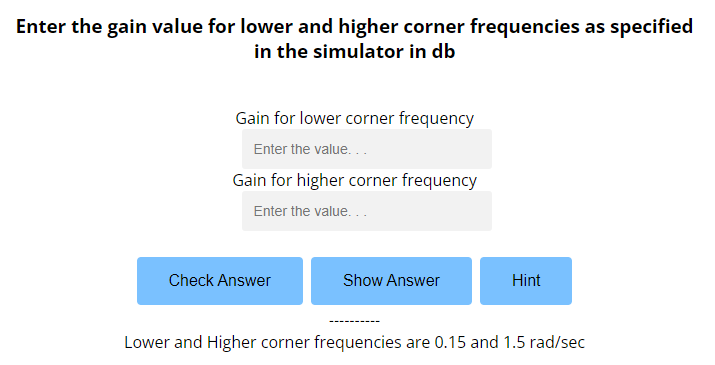
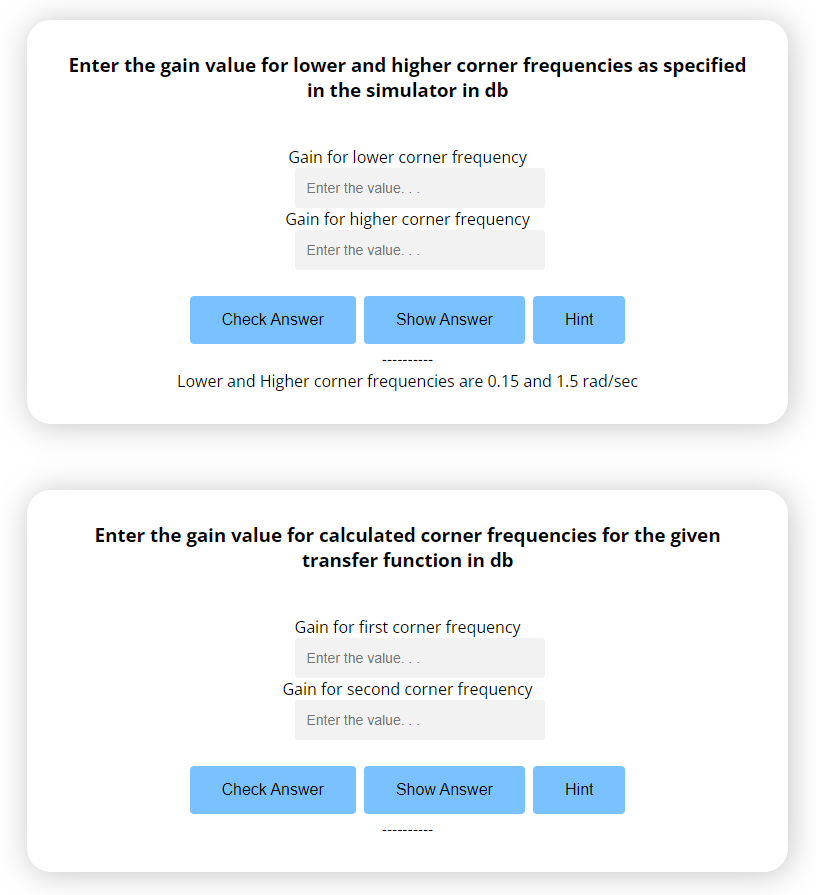
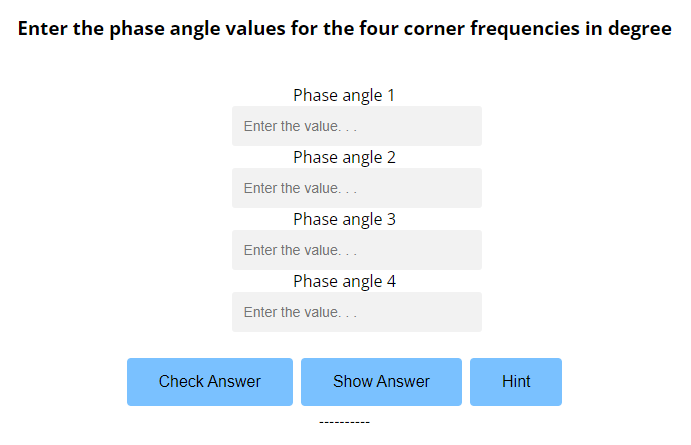
The user would assign the lower and higher corner frequencies as suggested by the simulator ( Lower and Higher corner frequencies are 0.15 and 1.5 rad/sec) and calculate gain a phase angle using the formula and feed the answers in specific text box given. Then the user will press check answer and display the solutions for checking the entered values are correct. If the answer is correct, the simulation will display ‘Correct’ else the user can click the hint/help button to get the formula to be used for calculation.
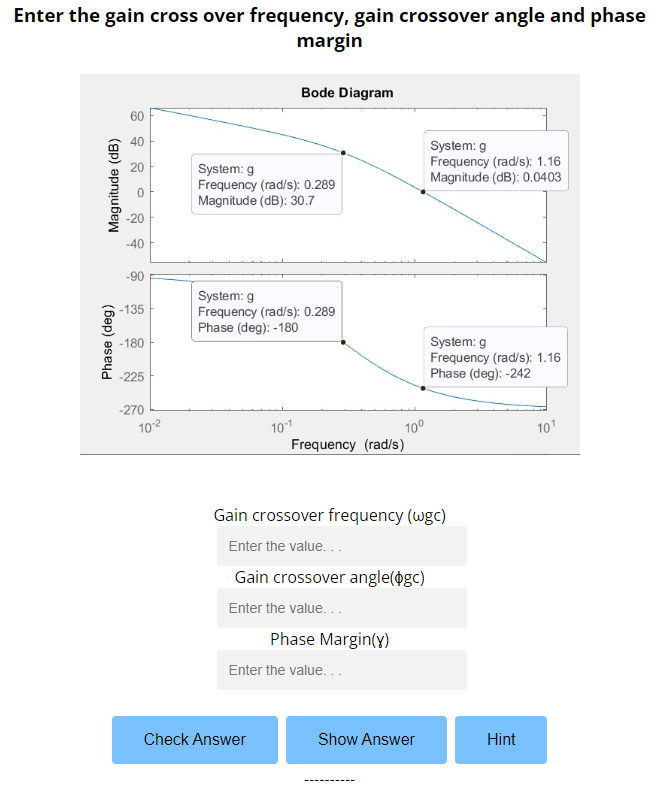
Then the simulator will display the final bode magnitude plot and bode phase plot.
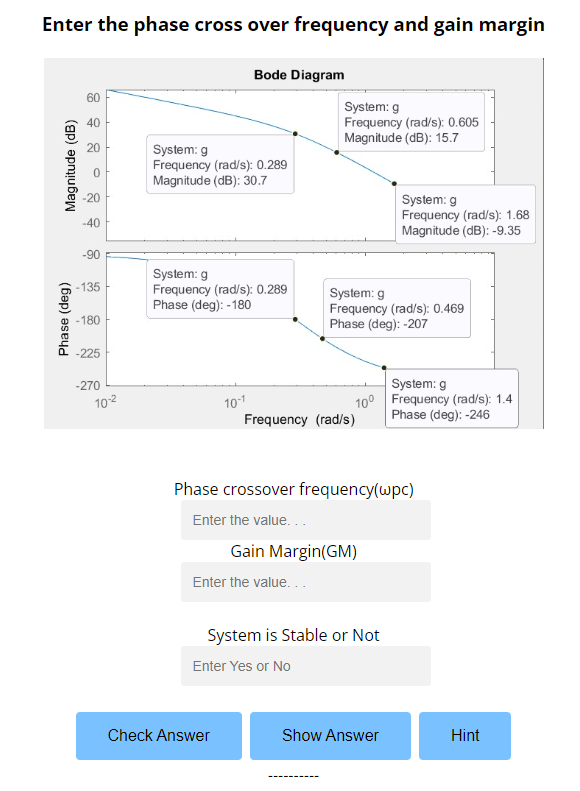
The user would inspect the magnitude and phase plot to obtain the gain and phase angles and feed the answers in specific text box given. Then the user will press check answer and display the solutions for checking the entered values are correct. If the answer is correct, the simulation will display ‘Correct’ else the user can click the hint/help button to get the formula to be used for calculation. Finally, the user needs to observe the plot and analyse the stability of the system and need to enter yes or no and check the answer for the correctness. If the answer is correct, the simulation will display ‘Correct’ else the user can click the hint/help button to get hint.
We Acknowledge NITK and PALS for extending their support towards successful completion of this experiment